R 101 for MESCAL and MOAIS
Table of Contents
Sitemap
|
|


Recently, I felt I have to give an overview to my colleagues of what was possible with R. There are a lots of presentation out there but I wanted something more suited to this audience. Here is what I talked about.
Why R?
R is a great language for data analysis and statistics
- Open-source and multi-platform
- Very expressive with high-level constructs
- Excellent graphics
- Widely used in academia and business
- Very active community
- Documentation, FAQ on stackoverflow
- Great integration with other tools
Why is R a pain for computer scientists ?
- R is not really a programming language:
- You should always avoid to code with it
- The semantic and syntax is uggly
- It is interpreted, hence slow
- Documentation is for statisticians
- Default plots are
cumbersome(meaningful) - Summaries are
cryptic(precise) - Steep learning curve even for us, computer scientists whereas we generally switch seamlessly from a language to another! That's frustrating! ;)
Do's and dont's
R is high level, I'll do everything myself
- CTAN comprises 4,334 TeX, LaTeX, and related packages and tools. Most of you do not use plain TeX.
- Currently, the CRAN package repository features 4030 available packages.
- How do you know which one to use ??? Many of them are highly exotic (not to say useless to you). http://www.r-bloggers.com/
- Lots of introductions but not necessarily what you're looking for so I'll give you a short tour.
You should quickly realize though that you need proper training in statistics and data analysis if you do not want tell nonsense.
Install and run R on debian
apt-cache search r
Err, that'is not very useful :) It's the same when searching on google but once the filter bubble is set up, it gets better…
  sudo apt-get install r-base
  R
Install a few cool packages
ddply, reshape and ggplot2 (Hadley Wickham) http://had.co.nz/
    install.packages("plyr")
    install.packages("reshape")
    install.packages("ggplot2")
knitR (Yihui Xie) http://yihui.name/knitr/
install.packages("knitr")
IDE
Interactive use is nice but quickly becomes painful so at some point, you'll want an IDE.
Emacs is great but you'll need Emacs Speaks Statistics
sudo apt-get install ess
Soon you may fall in love with org-mode. Although part of it comes in the base emacs installation, you will need the full package to have babel working.
sudo apt-get install org-mode
You may want to give a try to Rstudio or R-commander
sudo apt-get install rtudio r-cran-rcmdr
Roadmap
- Read data into a dataframe
library(plyr)
library(ggplot2)
df <- read.csv("http://mescal.imag.fr/membres/arnaud.legrand/uss_simgrid/tau.csv", header=FALSE, strip.white=TRUE)
names(df) <- c("Nature","ResourceId","Type","Start","End","Duration","Level","Value")
df = df[!(names(df) %in% c("Nature","Type","Level"))]
- Explore the content:
names?namesto get the help on a functionhead,tail, df[2:5,] (do not forget the ",") ,dim,length,df$toto, df[df$toto=="t",] (again, do not forget the final ",")str,summary
- Reshape it a little
block <- function(proc) {
  end <- proc$Start
  end <- end[2:length(end)]
  start <- proc$End
  start <- start[1:(length(start)-1)]
  d <- data.frame(ResourceId=unique(proc$ResourceId),
                  Start = start, End=end, Duration = end-start,
                  Value= "computing")
  d
}
compute_durations <- function(df) {
  d <- data.frame()
  for(rank in unique(df$ResourceId)) {
    d=rbind(d,block(df[df$ResourceId==rank,]))
  }
  # Let's merge these two frames together but allow to distinguish
  # between them.
  d$Type = "Computation"
  df$Type = "Communication"
  rbind(df,d)
}
df_tau <- compute_durations(df)
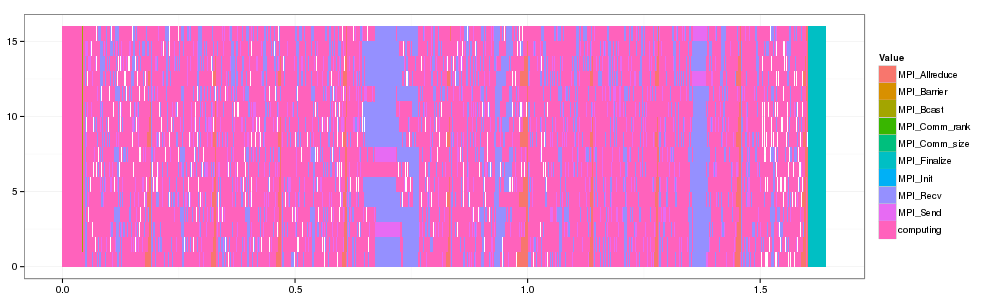
- Plot a bunch of things
ggplot(df_tau,aes(xmin=Start,xmax=End, ymin=ResourceId, ymax=ResourceId+1,fill=Value))+theme_bw()+geom_rect()
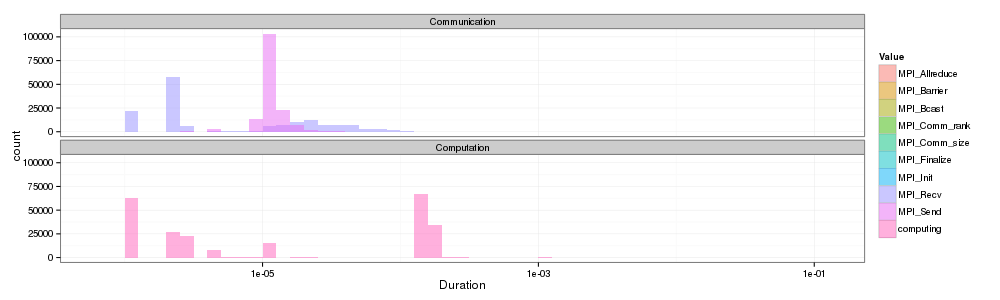
p <- ggplot(df_tau,aes(x=Duration,fill=Value))+theme_bw()+scale_x_log10()
p+geom_histogram(position="identity",alpha=.5,binwidth=.1)+facet_wrap(~Type,ncol=1)
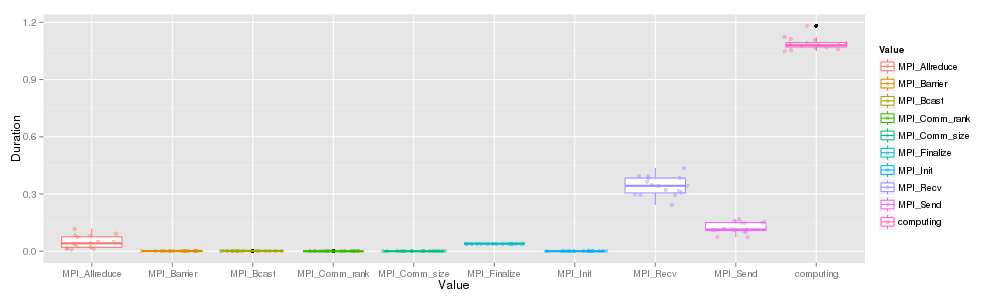
- Aggregates and replot
df_sum_tau <- ddply(df_tau, c("Value","ResourceId"),summarize, Duration = sum(Duration))
p <- ggplot(df_sum_tau, aes(x=Value, y=Duration,color=Value))
p + geom_boxplot() + geom_jitter(alpha=.4)
Take away
- R is a great tool but is only a tool. There is no magic. You need to understand what you are doing and get a minimal training in statistics.
- It is one of the building block of reproducible research (the reproducible analysis block) and will save you a lot of time.
- Read at least Jain's book: The Art of Computer Systems Performance Analysis. There are many other references on Jean-Marc's shelves or on mine.
Entered on