Distributed Lagrangian
Table of Contents
Sitemap
|
|


From Flow Control in Multi-path Networks to Multiple Bag-of-tasks Application Scheduling on Grids
This web page gather some information about work we have conducted on scheduling of multiple Bag-of-tasks applications on Grids. This work is inspired by network engineering techniques from flow control in multi-path networks, in particular distributed Lagrangian optimization. It relies on a primal-dual optimization and a distributed algorithm based on waves for data aggregation and distribution. Such algorithm has a nice interpretation in term of supply and demand.
This work has been published as INRIA research report RR-7745
Technical information for going further
The SimGrid version used for these experiments is
url = git://scm.gforge.inria.fr/simgrid/simgrid.git
SHA-1: d1ddbd23d6d9204fe614bd26a2c064f51f7820b0
branch: master, remotes/origin/master
date: 2011-06-15 13:55:34
distla_src.zip contains the simgrid user code that implements the distributed Lagrangian optimization. Several versions (from basic naive implementation to Newton optimized steps) are available.
experimental_results.tgz contains the output of the various experiments we ran along with the R scripts used to analyze these outputs (ANOVA+histograms).
The input platform files and the intermediary output files are really large but they can be provided on demand along with the perl scripts we used to generate them.
Illustration of the convergence
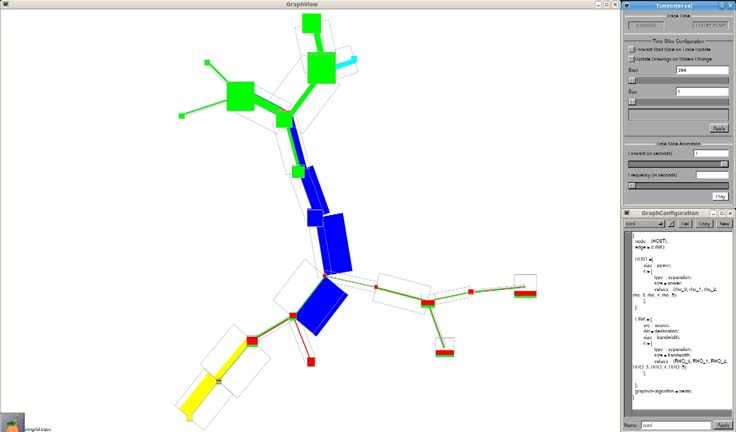
Below is a video (also available as an mpeg file) that illustrates the dynamic of the algorithm on a small platform with 5 different applications competing for resources using Triva. Squares depict computing resources and their size is proportional to their computing power. Boxes are connected with rectangles that represent communication links and whose width is proportional to their bandwidth. Each resource is filled with colors (one for each application) which indicates how much share of the resource the corresponding application uses. Sometimes, the filing of a resource exceed the size of the box or of the rectangle, which means that the resource is saturated.
At time 0:02, the configuration is set to display the instantaneous value at time 0. Since the system is initialized with random values, this corresponds to an unfeasible solution, which explains why all resources are saturated. From second 0:04, we animate through time and can see saturation disappear and convergence. The evolution through time of the spatial layout on of application is interesting and non-trivial.
In particular, the blue application, which is in the center of the platform and hence competes with many other applications somehow keeps trying to invade other locations at some point. It has a high communication to computation ratio, which explains why it is somehow stuck there anyway. Although, it keeps causing a resource saturation, it does not impact the other applications that keep a steady throughput.